
The Rigged Map --Part 1: How They Drew the Map
The making and unmaking of one gerrymandered district, and why most are still standing


Before 2011, Pennsylvania’s 7th congressional district was a place where elections actually mattered. The district covered most of Delaware County, the Philadelphia suburbs west and south of the city. From the mid-1970s through the late 1980s it elected a Democrat; from then through the mid-2000s, a Republican, Curt Weldon. In 2006, Navy vice admiral Joe Sestak defeated Weldon in a contested race. When Pat Meehan won the seat back in 2010, he did so by a competitive margin against a state representative named Bryan Lentz. That was a real district. Voters in it could plausibly affect its outcome. Both parties had to compete for it.
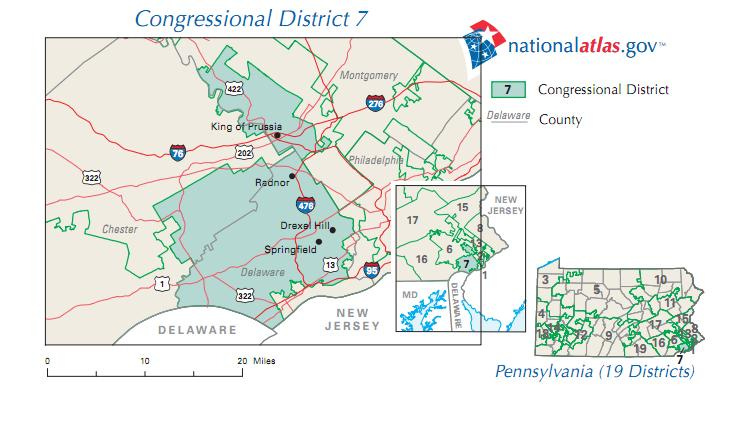
A year later, the district ceased to exist.
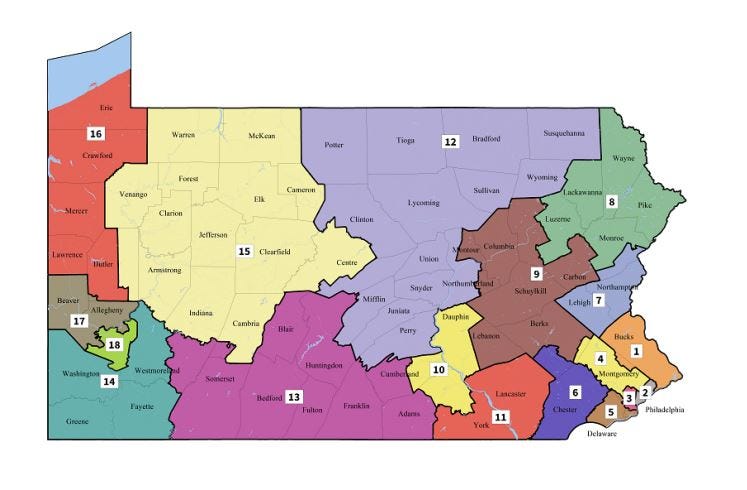
What replaced it became, almost immediately, a national joke. The new 7th sprawled across five counties — Delaware, Chester, Montgomery, Berks, and Lancaster — connected by passages so narrow that at one point, in King of Prussia, the entire district squeezed through a strip of land barely wider than the parking lot of a steakhouse called Creed’s Seafood and Steaks. The Washington Post named it one of the ten most gerrymandered districts in America. The shape was widely compared to a Disney cartoon: Goofy kicking Donald Duck.
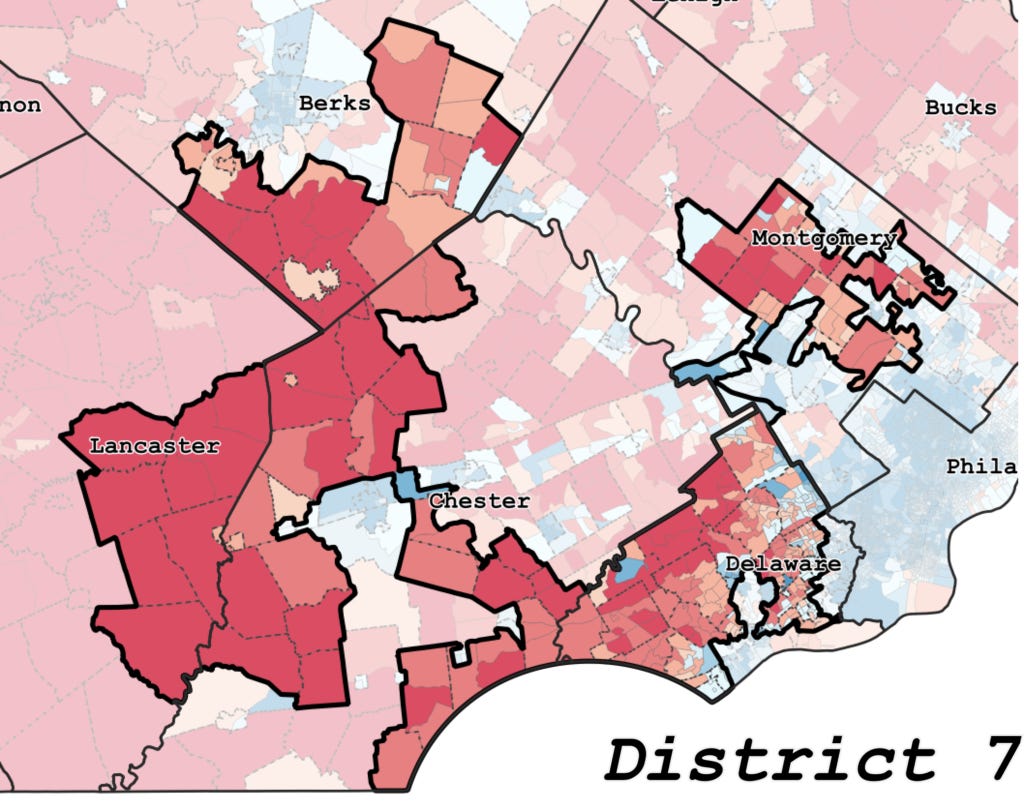
The lines were not random. They cracked Pennsylvania’s fifth-largest city, Reading — one of the poorest urban communities in the country — across multiple districts, pairing its voters with Lancaster County farmers and rural Chester County landowners. The purpose was to dilute the Democratic-leaning voters of Delaware County by pairing them with enough rural Republican territory in four other counties that the aggregate vote in the new 7th would come out Republican by a comfortable margin — regardless of how strongly the people in Delaware County voted. Their votes still counted. The map ensured they would be outnumbered.
It worked. Meehan won the new 7th with 60 percent of the vote in 2012, 62 percent in 2014, and 60 percent again in 2016. He never faced a competitive primary. He never faced a competitive general election. From the moment the new lines were enacted until he resigned in 2018 amid a sexual harassment settlement scandal, the seat was effectively uncontested — not because Delaware County had stopped being purple, but because the map guaranteed that whoever the Republican primary chose would win the general.
This is how a district disappears. The people who lost were not the Democratic Party — which survived 2012, 2014, and 2016 without difficulty. The people who lost were the residents of PA-7 themselves, Republican and Democrat and unaffiliated, whose representative no longer needed to listen to them because the map had decided he didn’t have to. The same arrangement, drawn by Democrats in Illinois, produces the same result for voters in the packed Republican districts there. The party machinery on either side survives. The voters do not.
The story of how this happened begins not in Pennsylvania but in a Republican strategist’s reading of the New York Times.
The Plan
In early 2009, Chris Jankowski, executive director of the Republican State Leadership Committee, came across an article noting that 2010 would be a census year. The next round of state legislative elections would determine who controlled congressional redistricting for the entire decade. Jankowski did the arithmetic. Eighteen state legislative chambers, he later said, had partisan margins of four seats or fewer. Those chambers, in those states, would decide American politics until at least 2022.

The plan he developed was called REDMAP. It identified 107 state legislative races in 16 states — Pennsylvania, Ohio, Michigan, Wisconsin, North Carolina, and Florida as priority targets — with a fundraising goal of roughly $30 million. Trivial in federal politics; enormous in down-ballot races where a few hundred thousand dollars could swing an outcome. In March 2010, Karl Rove published an op-ed in the Wall Street Journal endorsing the strategy. Its subhead read: He who controls redistricting can control Congress.
In Pennsylvania, REDMAP spent close to a million dollars on three state House races and won all three. Combined with the 2010 Republican wave, Republicans flipped the Pennsylvania House and the governorship while holding the Senate — unified control of all three for the second consecutive redistricting cycle, this time with the strategic infrastructure to lock the new maps in place. The wave alone might have produced the same legislative majorities. What REDMAP added was the second prong: lawyers, mapping software, and operatives ready to draw districts that would survive future waves. Waves recede. Maps do not.
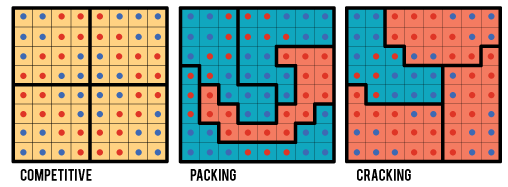
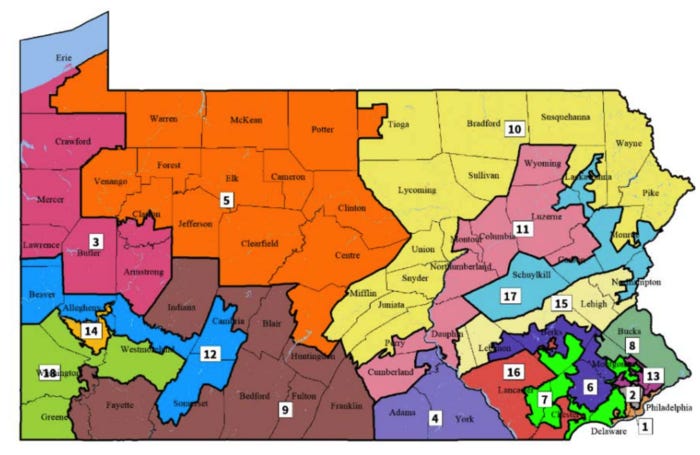
Drawing Pennsylvania’s new congressional map happened largely behind closed doors. The legislature’s Republican leadership released a redistricting bill in September 2011 that contained no map at all, only placeholder language. The actual map appeared in mid-December and was approved by the state Senate on a 26-24 party-line vote. Democratic state Senator Vincent Hughes pointed out the design. Of Pennsylvania’s eighteen U.S. House districts, both plans would give Democrats roughly four safe seats. But the Republican plan would produce twelve safe Republican seats and just two genuinely competitive districts. The Democratic alternative would have produced eight safe Republican seats and six competitive ones. Even the Democratic counter-plan favored Republicans. The Republican plan was different in kind — not designed to give Republicans a majority, but to eliminate competition.
The pattern that followed vindicated the design. Through this period, Pennsylvania had roughly a 10-point Democratic registration advantage. Across 2012, 2014, and 2016, Republicans held 13 of Pennsylvania’s 18 House seats — a 72 percent share, year after year, in a state Hillary Clinton lost by less than one percentage point and Obama carried twice. The single most revealing year was 2012. Pennsylvania that November reelected Obama by more than five points, reelected Democratic Senator Bob Casey Jr. by nearly nine, and gave Democratic congressional candidates a majority of votes cast statewide. They received five of eighteen House seats in return.
The Cost
What this meant for voters inside districts like the 7th was a slow disappearance of representation. Retirees at Kendal-Crosslands, carved out of the 7th into a district whose representative lived an hour away in Lancaster County, told reporters their letters came back as canned form responses on issues they hadn’t raised.
One wrote about health care. The reply thanked them for their interest in deer hunting.
By 2017, with constituent pressure cresting on the Trump administration and the ACA, Meehan declined to hold open in-person town halls, defending tele-town halls as “a very effective way to stay in touch.” Aides screened the questions. There were no follow-ups. A representative whose seat is gerrymandered to win by twenty-plus points has no electoral incentive to face an angry crowd. The crowd cannot remove him. The map has already settled that.
Something else fills the accountability void. In a gerrymandered safe seat, only a primary can remove an incumbent — and corporate money has colonized primaries too, funding incumbents and any challengers who might emerge against them. There is no longer a moment in the electoral cycle where an ordinary voter’s preference reliably determines who represents PA-7. Accountability flows toward the funders. That is not a quid pro quo. It is gravity. Meehan’s largest industry source of contributions over his career was Lawyers and Law Firms. The largest employment sectors for actual PA-7 residents, per the 2012 Census, were Educational Services and Health Care and Social Assistance: teachers, nurses, hospital staff, social workers. The people writing checks to keep him in Washington and the people whose work filled his district were not the same population.
The Court
The 7th was not undone by an election. It was undone by a state Supreme Court. Gerrymanders are not permanent. They can be reversed.

In June 2017, the League of Women Voters of Pennsylvania filed a state-court lawsuit alleging the 2011 map violated the Pennsylvania Constitution’s Free and Equal Elections Clause. On January 22, 2018, the Pennsylvania Supreme Court agreed 5-2, ruling the map a “severe and durable” partisan gerrymander. When the legislature could not produce a remedial plan, the court drew one itself.
The new map was fair. Most of the old 7th became part of a new 5th covering all of Delaware County, and in November 2018, attorney Mary Gay Scanlon won it decisively against Republican Pearl Kim. Across the state, Pennsylvania’s House delegation moved from 13-5 Republican to 9-9. Two cycles later, under another court-drawn map after the 2020 census, the same state elected 10 Republicans and 7 Democrats in 2024. A fair map moves with the voters. A gerrymandered map does not. That is what makes one rigged and the other not.
The catch is that this remedy was specific to Pennsylvania. The federal courts that voters in other states might have used are no longer available — two recent Supreme Court rulings, Rucho v. Common Cause in 2019 and Louisiana v. Callais last month, closed the federal pathways for partisan-gerrymandering claims and for most challenges under the Voting Rights Act. That leaves only state court, under a state constitution, in the small number of states with strong enough language and a willing court.
Roughly a dozen states qualify; most states with the worst gerrymanders do not. North Carolina tried this same path in 2022 and won; then Republicans took the state supreme court that fall and reversed the ruling. Pennsylvania got lucky. Most states have not. And the path is itself under attack — the same Republican organization that funded REDMAP in 2010 has spent more than $29 million since 2014 to elect conservative state supreme court justices in the states where the federal door is now closed. We return to that fight in Part 9.
The map did not happen by accident. It was conceived as a strategy, funded as an investment, executed as a campaign, and sustained as a structural advantage. It produced a representative who stopped needing the people he represented because the people who could remove him were elsewhere. Multiply that across roughly 340 congressional districts and hold it for a decade, and you have explained a substantial portion of why the United States Congress no longer responds to majorities of its own voters.
In Part 2, we follow the legal architecture as it was dismantled — from Buckley v. Valeo in 1976, through Citizens United in 2010, through Rucho in 2019, through the Callais decision last month. The law is the second half of the machine.
Stay Angry
Sources — The Rigged Map: Part 1
League of Women Voters v. Commonwealth of Pennsylvania, 178 A.3d 737 (Pa. 2018).
Daley, David. Ratf**ked: The True Story Behind the Secret Plan to Steal America’s Democracy. W.W. Norton, 2016.
Rove, Karl. “He Who Controls Redistricting Can Control Congress.” Wall Street Journal, March 4, 2010.
Republican State Leadership Committee. REDMAP post-election analysis, 2012.
National Public Radio, Fresh Air. “Understanding Congressional Gerrymandering” — interview with David Daley, June 15, 2016.
WBUR, Here & Now. “’Gerrymandering On Steroids’: How Republicans Stacked the Nation’s Statehouses.” July 19, 2016.
WHYY. McKelvey, Wallace. “Touring Pa.’s 7th congressional district.” February 2018.
Public Interest Law Center. Pennsylvania Redistricting Lawsuit case page.
Fair Districts PA. “About Gerrymandering” and “A recent history of the PA Supreme Court’s role in redistricting” (September 13, 2025).
Grofman, Bernard, and Jonathan R. Cervas. “Can State Courts Cure Partisan Gerrymandering.” Election Law Journal 17(4) (2018).
PBS NewsHour. “GOP gerrymandering creates uphill fight for Dems in the House.” March 31, 2014.
Philadelphia Inquirer. “As Trump critics demand an audience, Republicans avoid town halls.” February 18, 2017.
Philadelphia Inquirer. “Mary Gay Scanlon wins Pa.’s Fifth Congressional District.” November 7, 2018.
OpenSecrets and Ballotpedia. Campaign finance summaries for Patrick Meehan (PA-7), 2010–2018.
U.S. Census Bureau. American Community Survey, Pennsylvania Congressional District 7, 2012.
Ballotpedia. “Pennsylvania’s 7th Congressional District” historical pages, 2010–2018.
Wikipedia. “Pennsylvania’s 7th congressional district”; “Redistricting in Pennsylvania”; “REDMAP”; “Pat Meehan”; “Mary Gay Scanlon.”
Rucho v. Common Cause, 588 U.S. 684 (2019).
Louisiana v. Callais, 608 U.S. ___ (2026). On the Supreme Court’s gutting of Section 2 of the Voting Rights Act.
Slate. “Pennsylvania Just Gave Every State Court a Blueprint to Strike Down Partisan Gerrymandering.” February 2018. On the dozen-plus states with Free and Equal Elections Clauses.
State Court Report. Coverage of state supreme court races and partisan composition, 2024–2026. On the North Carolina Supreme Court reversal after the 2022 partisan flip.